Continuing from Part 1, here we will be Explaining Interactive Qualitative Analysis (IQA) | Interpreting Results.
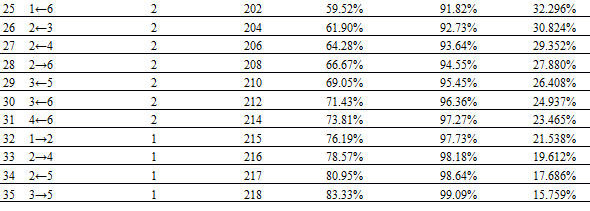
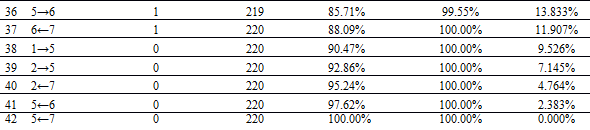
Table 1 below illustrates the affinity pairs’ frequencies, indicating that 13 of 42 relationships explained 71.82% of the variance. There is a combination of 21 pairs when multiplied by 2 causal directions, it amounts to 42 relationships.
Since the first 13 relationships explained 71.82% of the variation, a representative sample of affinity pairs was obtained. To sum up, a running total of factors contributing to staff retention constitutes the cumulative frequency.
The cumulative percentage is the number of possible relationships. Therefore the power indicates the position where the maximum number of frequencies was reached using the simplest method, in this case at 40.866%, which is at the 13th relationship.
Table 1
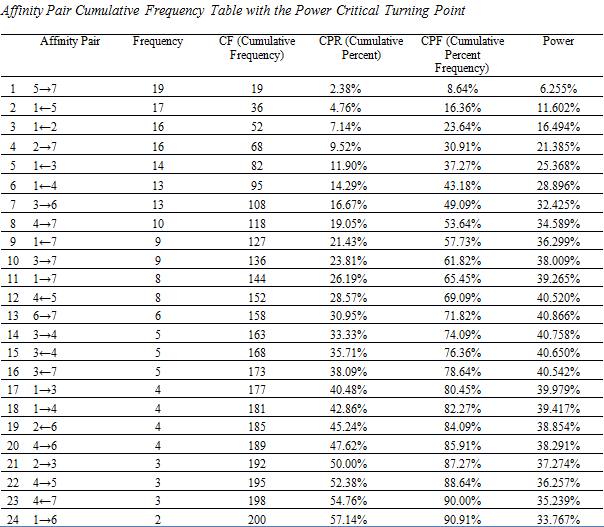
Only one conflicting pair was identified. Conflicts occur when construct pairs indicate multidirectional frequencies up to the critical turning point. In this case, 7←1 received a frequency count of 9 and 1→ 7 a frequency count of 8.
Since 7←1 had the highest frequency count 1→ 7 was ignored.
The interrelational diagram (IRD)
Not only does the interrelational diagram (IRD) shown in Table 2 records the relationship for each pair with an arrow, but also indicates the direction of the influence on relationships. As shown in the IRD diagram, the relationships of the pairs above the shaded blocks mirror the relationships below.
Table 2
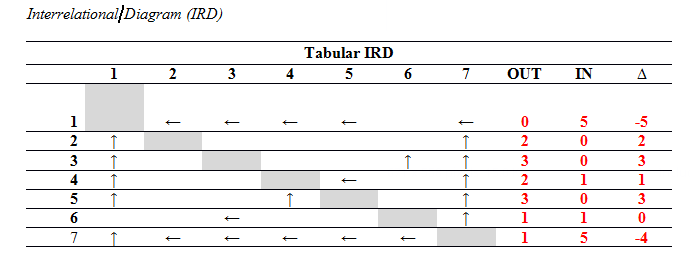
To obtain Delta values primary and secondary drivers were counted, ← IN values, and outcomes (secondary/primary) ↑ OUT values, then subtracting the OUT values (secondary/primary outcomes) by the IN values (primary/secondary drivers) to get the ∆ (delta) value.
Positive delta values are drivers or causes because they influence relationships and therefore the arrows point towards the effected constructs. Negative delta values are outcomes because they are influenced by other constructs (Northcutt & McCoy, 2004). Here is part 1: Explaining Interactive Qualitative Analysis (IQA) – where we discuss about the identification of themes & direction of relationship and part 3: Explaining Interactive Qualitative Analysis (IQA) | Final Discussion – where we identify the drivers (causes) & outcomes (effects).
Would you like to learn more about IQA?
Contact us at info@reprac.co.nz or follow this link to our contact form.
References (Part 1-3)
Example adapted from Northcutt, N., & McCoy, D. (2004)
Cowling, W. R. (2001). Unitary appreciative inquiry. Advances in nursing science, 23 (4), 32-48.
Northcutt, N., & McCoy, D. (2004). Interactional qualitative analysis. London: Sage.