The Interactive Qualitative Analysis (IQA) data collection method explores how meaning can be conceptualised by comparing and contrasting elements that results from polarised constructs. The systems influence diagram (SID) links construct relationships and clearly illustrates associations between the major influences (Northcutt & McCoy, 2004).
Data Collection Method: Interactive Qualitative Analysis (IQA)

Interactive Qualitative Analysis (IQA) involves a focus group’s participation in identifying themes emerging from data.
- Primary and secondary drivers (causes),
- pivots (delta from null), and
- primary and secondary outcomes (effects) (Northcutt & McCoy, 2004).
Primary drivers influence themes whereas secondary drivers have mutual influence. Pivots (delta from null) have the same number of unidirectional influences on themes (Cowling, 2001).
Secondary outcomes can be influenced but may also manipulate other themes whereas the primary outcomes have no influence (Northcutt & McCoy, 2004).
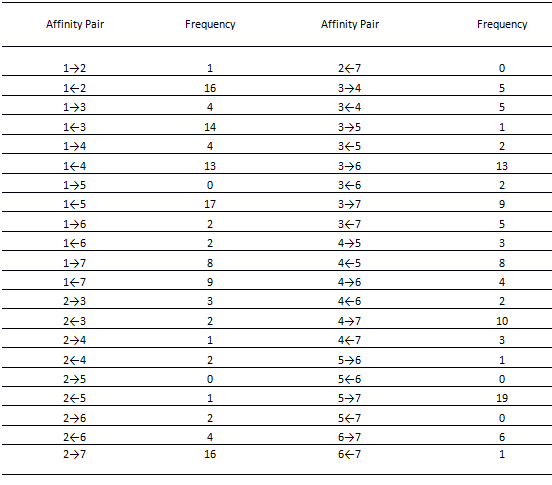
From the data an interrelational diagram (IRD) develops, which represents the frequency of themes within the model and the direction of influences (Cowling, 2001).
According to the Pareto Principle, the maximum number of frequencies brings about a distribution of relationships as dictated by the power law. The power indicates the critical turning point and highlights the maximum variance peak (Northcutt & McCoy, 2004).
As an example, let’s assume employees were asked the following question “What do you think are the most important factors that influence staff retention?” This encourages discussion that facilitates data analysis after participants identify themes.
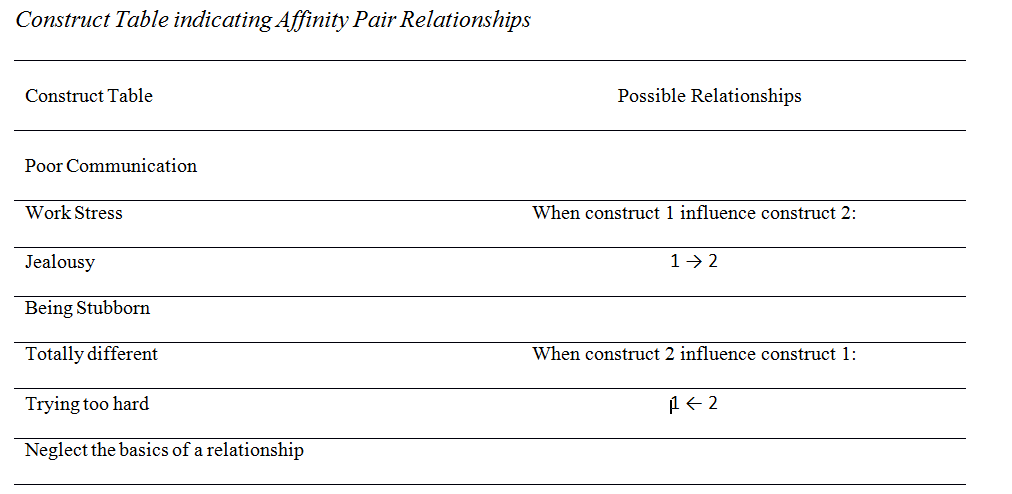
Table 1 shows the themes/constructs and how to indicate directions of relationships.
Table 1
Here is part 2: Explaining Interactive Qualitative Analysis (IQA) | Interpreting Results – where we will demonstrate how to interpret IQA results and part 3: Explaining Interactive Qualitative Analysis (IQA) | Final Discussion where we identify the drivers (causes) & outcomes (effects).
For more information, you can contact us at info@reprac.co.nz or follow this link to our contact form.
References (Part 1-3)
Example adapted from Northcutt, N., & McCoy, D. (2004)
Cowling, W. R. (2001). Unitary appreciative inquiry. Advances in nursing science, 23 (4), 32-48.
Northcutt, N., & McCoy, D. (2004). Interactional qualitative analysis. London: Sage.