Explaining Interactive Qualitative Analysis (IQA) | Final Discussion
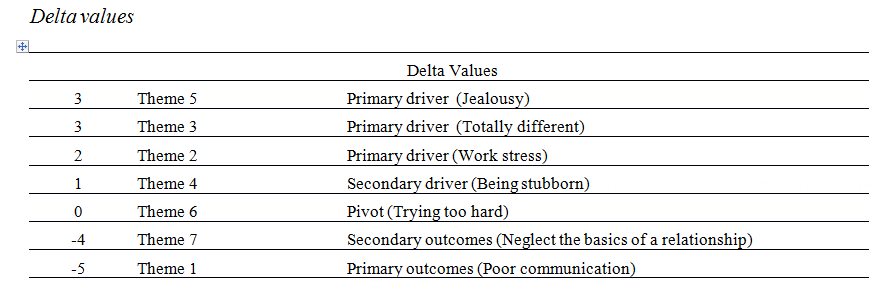
In this section, we are Explaining Interactive Qualitative Analysis (IQA) | Final Discussion. Next, deltas are arranged numerically in descending order to clearly identify the drivers (causes) and outcomes (effects). The pivot identifies the null delta since it had the same number of causes as effects, therefore ∆ = 0 as summarised in Table 1.
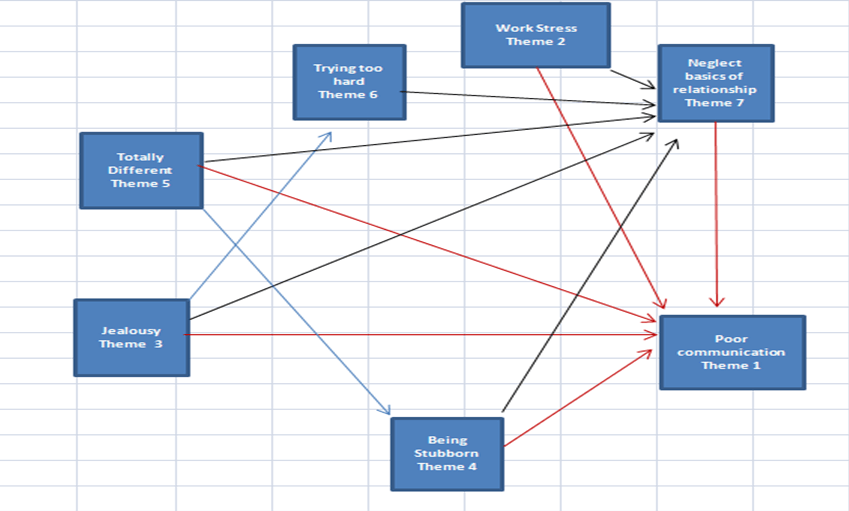
The systems influence diagram (SID), visually represents the 42 relationships as summarised in the Interrelational Diagram (IRD). It should be noted that the IRD only signifies the highest number of frequencies up to the critical turning point.
The cluttered SID, Figure 1, identifies the 3 primary drivers namely totally different (theme 5) ∆=3, jealousy (theme 3) ∆=3 and work stress (theme 2) ∆=2 due to their influence on other relationships. Theme five has the highest frequency count as noted in Table 2 – Affinity Pair Cumulative Frequency Table – followed by theme 2 and 3.
Being stubborn (theme 4) is a secondary driver ∆=1 due to the positive total of multidirectional influences. The pivot ∆=0 is trying too hard (theme 6) and realised an equal sum of multidirectional influences.
The secondary outcome is neglecting the basics of relationships (theme 7) ∆= -4 due to the negative sum of multidirectional influences. Poor communication (theme 1) is the primary outcome ∆= – 5 being influenced by all themes.
Figure 1
Discussion
Figure 2 presents a clutter-free illustration that demonstrates the relationships between the major influences once redundant links have been removed. It, therefore, presents a clearer depiction of the relationships.
Figure 2. An uncluttered systems influence diagram (SID).
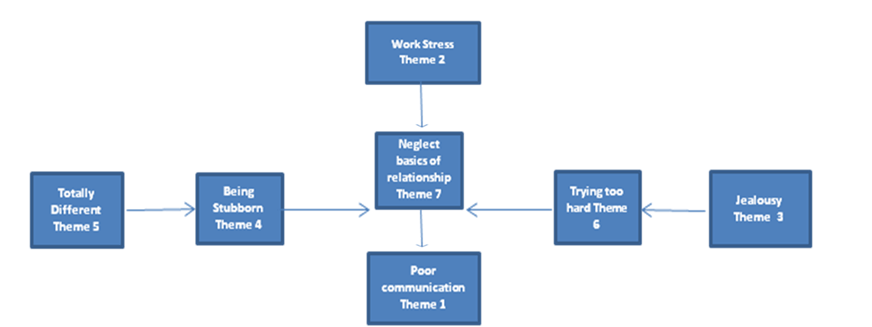
In this Interactive Qualitative Analysis (IQA) example employees indicated various factors, that influence staff retention, including work stress, jealousy, stubbornness, trying too hard and other factors that led to neglecting basics of their relationships. This had an impact on the breakdown of communication and staff retention.
Follow these links to part 1: Explaining Interactive Qualitative Analysis and part 2: Explaining Interactive Qualitative Analysis (IQA) | Interpreting Results if you would like to read more about this topic.
Tell us what you think about IQA? We’d like to hear from you.
Contact us at info@reprac.co.nz or follow this link to our contact form.
References (Part 1-3)
Example adapted from Northcutt, N., & McCoy, D. (2004)
Cowling, W. R. (2001). Unitary appreciative inquiry. Advances in nursing science, 23 (4), 32-48.
Northcutt, N., & McCoy, D. (2004). Interactional qualitative analysis. London: Sage.